Difference between revisions of "How to debug"
(→Play-Out View) |
|||
| (One intermediate revision by one user not shown) | |||
| Line 1: | Line 1: | ||
| − | Debugging is by default enabled whenever you play out. | + | Debugging is by default enabled whenever you play out. To disable/enable debugging, check the corresponding flag in the 'Play-Out' properties by right-clicking your project and choosing properties-->PlayGo-->Play-Out-->General tab-->Debug flag: |
| − | To disable/enable debugging, check the corresponding flag in the 'Play-Out' properties by | + | |
| − | right-clicking your project and choosing properties-->PlayGo-->Play-Out-->General tab-->Debug flag: | + | |
| − | [[ | + | [[File:Playout.properties.general.jpg|800px|Playout.properties.general.jpg]]<br/>When playing-out you can see information about the LSC execution in the 'Play-Out' view, and you can set breakpoints directly on the LSC diagram or in the Java code. |
| − | <br> | + | |
| − | When playing-out you can see information about the LSC execution in the 'Play-Out' view, and you can set breakpoints directly on the LSC diagram or in the Java code. | + | |
| − | ==Play-Out View== | + | == Play-Out View == |
| − | [[ | + | |
| − | <br> | + | [[File:PlayoutView.jpg|800px|PlayoutView.jpg]]<br/>The Play-Out view displays the information logged at runtime by the [[The Tracer|Tracer]]. Each line represents an explicit or implicit event that occurred during execution. The information is grouped by events. The icon at each line defines the type of information it provides:<br/>[[File:Event.gif]] - information about the event that occurred in the system and triggered the steps included in this sub tree. Contains the event signature.<br/>[[File:Cut.gif]] - information about the cut change. Includes the name of the LSC, the sequence of locations that constitute the current cut, and whether the cut is hot or cold.<br/>[[File:Binding.gif]] - information about a binding of a lifeline. Includes the type of lifeline and the name of the bounded instance.<br/>[[File:Completion.gif]] - information about LSC completion/finish.<br/>[[File:ViolationHot.gif]] - information about a hot violation.<br/>[[File:ViolationCold.gif]] - information about a cold violation.<br/><br/>Upon clicking an entry in the view, a graphical indication is displayed on the diagram. For example, when clicking a 'cut change' entry, the cut is drawn on the diagram. [[File:PlayoutView.cutChange.jpg|800px|PlayoutView.cutChange.jpg]]<br/><br/>The information provided in the play-out view can be filtered using the filters provided in the view's toolbar:<br/>[[File:PlayoutView.filters.png|800px|PlayoutView.filters.png]] |
| − | The Play-Out view displays the information logged at runtime by the [[ | + | |
| − | [[ | + | == Applying breakpoints == |
| − | [[ | + | |
| − | [[ | + | |
| − | [[ | + | |
| − | [[ | + | |
| − | [[ | + | |
| − | <br> | + | |
| − | Upon clicking an entry in the view, a graphical indication is displayed on the diagram. For example, when clicking a 'cut change' entry, the cut is drawn on the diagram. | + | |
| − | [[ | + | |
| − | The information provided in the play-out view can be filtered using the filters provided in the view's toolbar:<br> | + | |
| − | [[ | + | |
| − | |||
Breakpoints can be applied at runtime on the diagram, as well as in the Java code. | Breakpoints can be applied at runtime on the diagram, as well as in the Java code. | ||
On the diagram, set a breakpoint by right-clicking a message and choosing 'Toggle Breakpoint': | On the diagram, set a breakpoint by right-clicking a message and choosing 'Toggle Breakpoint': | ||
| − | [[ | + | [[File:LSCEditor.breakpoint.png|800px|LSCEditor.breakpoint.png]] |
| − | <br> | + | <br/>Applying a breakpoint in the Java code is done in the standard way (e.g., right-clicking the left-hand side-bar of a source line and choosing 'Toggle Breakpoint'). |
| − | Applying a breakpoint in the Java code is done in the standard way (e.g., right-clicking the left-hand side-bar of a source line and choosing 'Toggle Breakpoint'). | + | |
| − | In both cases, the execution will stop when reaching a breakpoint. Once stopped, it can be resumed by clicking the resume button in the toolbar of the Debug view: | + | In both cases, the execution will stop when reaching a breakpoint. Once stopped, it can be resumed by clicking the resume button in the toolbar of the Debug view: [[File:DebugView.jpg|800px|DebugView.jpg]] |
| − | [[ | + | <br><br> |
| + | '''[[Troubleshoot#Play-out does not stop at breakpoint|Troubleshoot...]]''' | ||
Latest revision as of 07:46, 28 December 2015
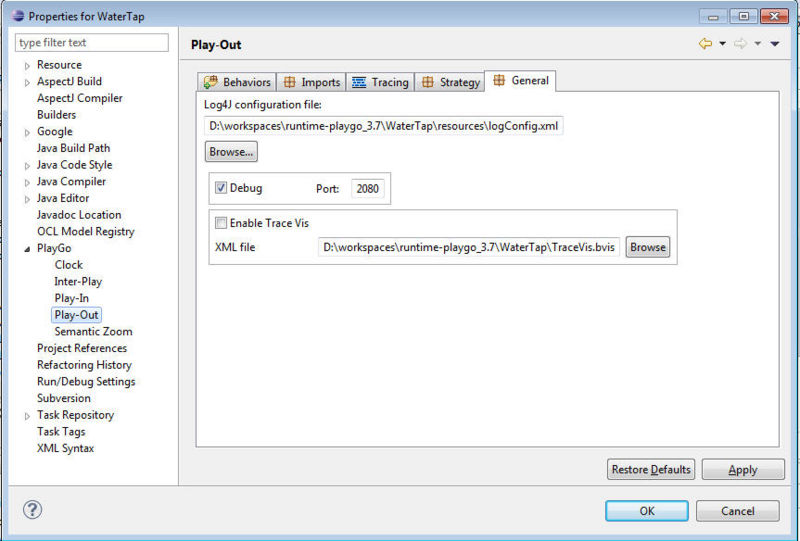
Debugging is by default enabled whenever you play out. To disable/enable debugging, check the corresponding flag in the 'Play-Out' properties by right-clicking your project and choosing properties-->PlayGo-->Play-Out-->General tab-->Debug flag:

When playing-out you can see information about the LSC execution in the 'Play-Out' view, and you can set breakpoints directly on the LSC diagram or in the Java code.
Play-Out View

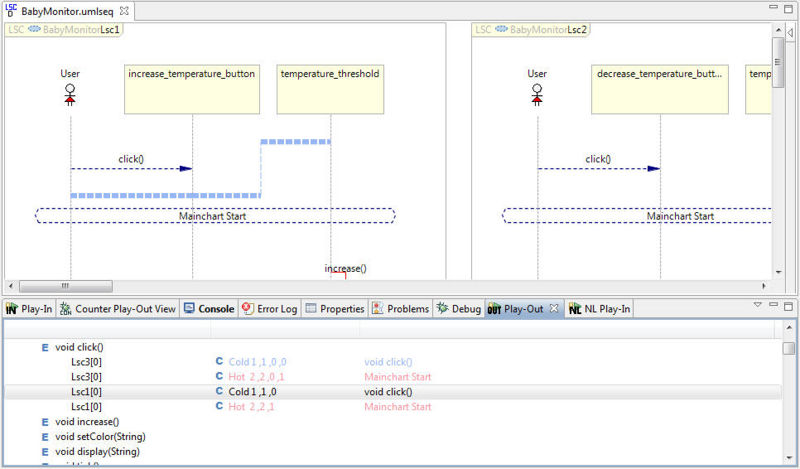
The Play-Out view displays the information logged at runtime by the Tracer. Each line represents an explicit or implicit event that occurred during execution. The information is grouped by events. The icon at each line defines the type of information it provides:![]() - information about the event that occurred in the system and triggered the steps included in this sub tree. Contains the event signature.
- information about the event that occurred in the system and triggered the steps included in this sub tree. Contains the event signature.![]() - information about the cut change. Includes the name of the LSC, the sequence of locations that constitute the current cut, and whether the cut is hot or cold.
- information about the cut change. Includes the name of the LSC, the sequence of locations that constitute the current cut, and whether the cut is hot or cold.![]() - information about a binding of a lifeline. Includes the type of lifeline and the name of the bounded instance.
- information about a binding of a lifeline. Includes the type of lifeline and the name of the bounded instance.![]() - information about LSC completion/finish.
- information about LSC completion/finish.![]() - information about a hot violation.
- information about a hot violation.![]() - information about a cold violation.
- information about a cold violation.
Upon clicking an entry in the view, a graphical indication is displayed on the diagram. For example, when clicking a 'cut change' entry, the cut is drawn on the diagram. 
The information provided in the play-out view can be filtered using the filters provided in the view's toolbar:
Applying breakpoints
Breakpoints can be applied at runtime on the diagram, as well as in the Java code.
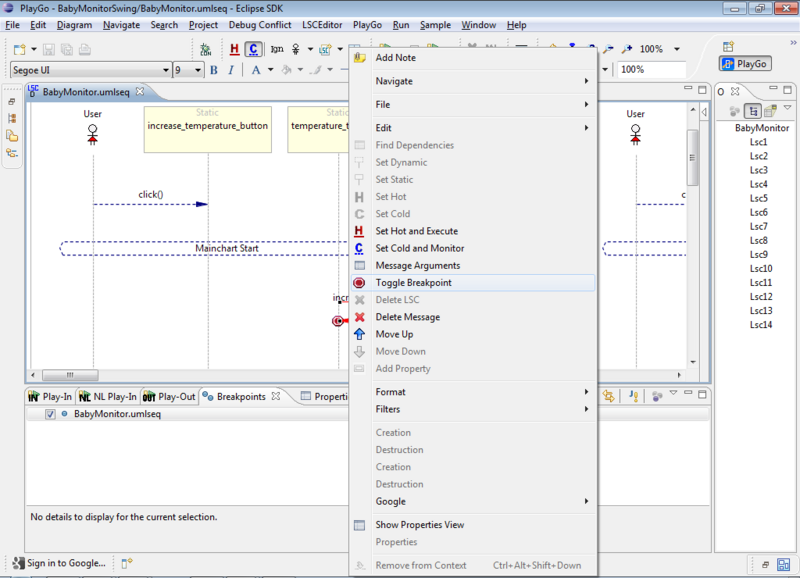
On the diagram, set a breakpoint by right-clicking a message and choosing 'Toggle Breakpoint':
Applying a breakpoint in the Java code is done in the standard way (e.g., right-clicking the left-hand side-bar of a source line and choosing 'Toggle Breakpoint').
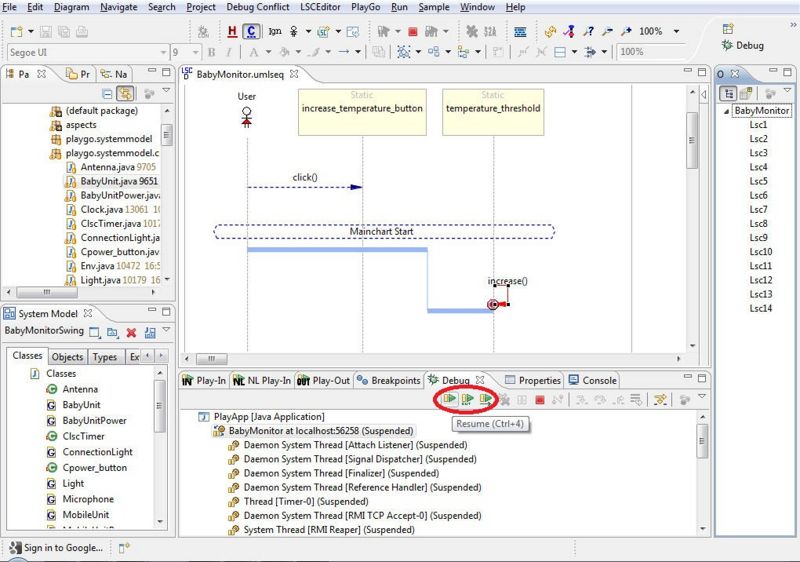
In both cases, the execution will stop when reaching a breakpoint. Once stopped, it can be resumed by clicking the resume button in the toolbar of the Debug view: 
Troubleshoot...
