TraceVis
From BP Wiki
Contents
Debugging and visualizing behavioral Java programs with TraceVis
The TraceVis tools provides visualization for the concurrent execution of multiple b-threads, with indications of the events that are requested, waited-for and blocked at each synchronization point, providing insights into why a certain event is triggered and others are not.
This can be used for general program comprehension and for debugging specific flows.
TraceVis Setup and Activation
- Add the following parameter in run configuration -> arguments -> vm arguments:
-DgeneVisTrace=true
- Run the program as usual. The input to the trace visualization will be stored in <BProgram name>_log.xml.
- Open the file TraceVis.htm with the FIREFOX browser.
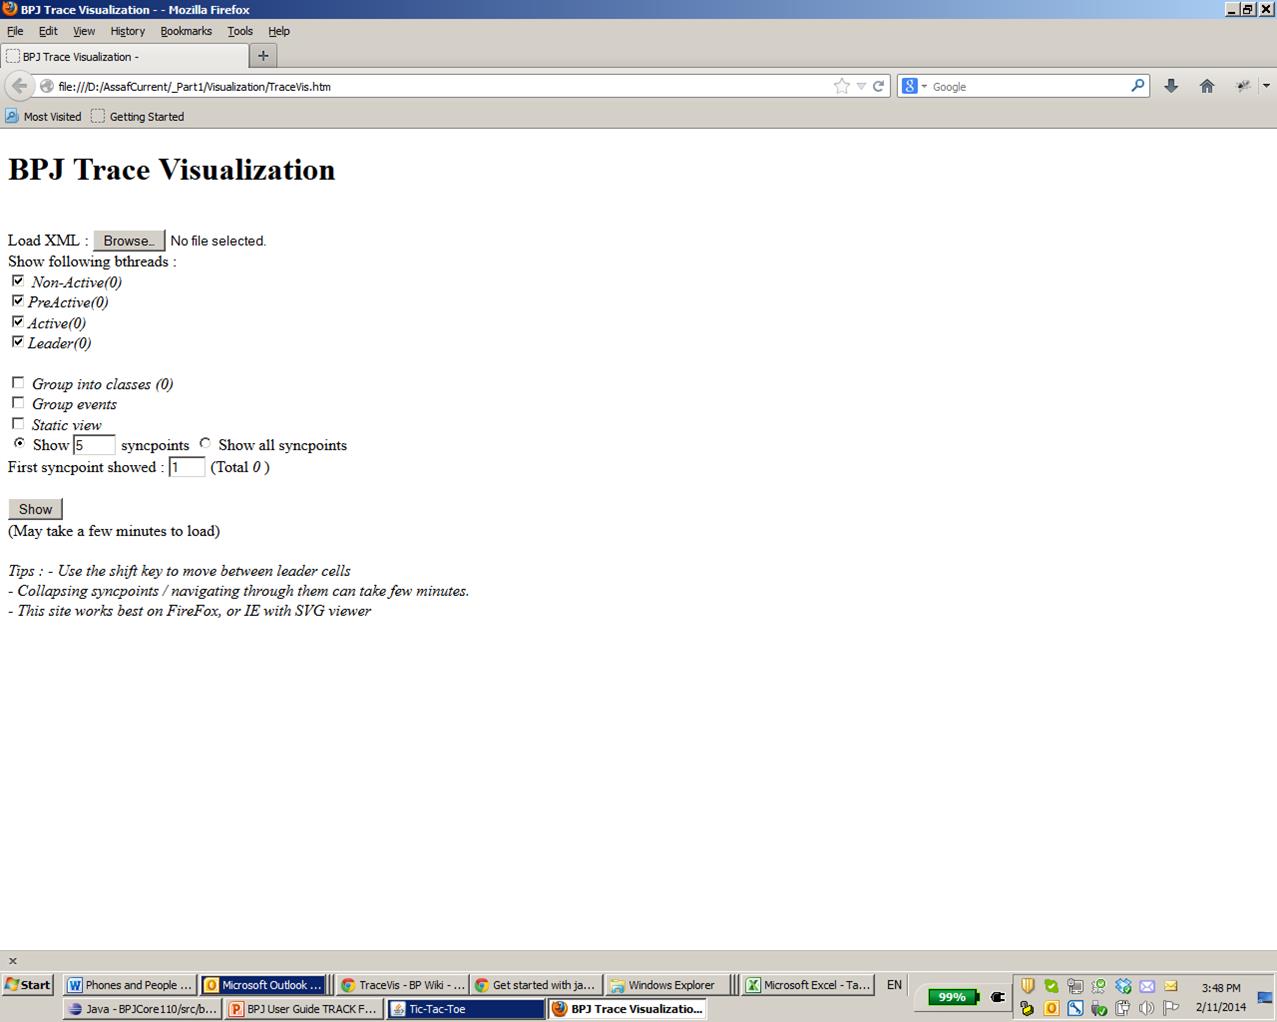
- The following menu will be displayed.
- In the BPJ Trace Visualization Menu browse and select the file <BProgram name>_log.xml.
- Choose the type of b-threads you want to display. B-threads are classified into 4 types, based on their actions in the traced run:
- Non-Active: b-threads that did not block or request anything, and did not advance; they waited for event sequences that did not occur.
- Active-follower: b-threads that advanced when certain events occurred, but did not block or request events.
- Active: b-threads that requested or blocked events, but didn’t lead the run, i.e., none of their requests affected the run.
- Active-leader: b-threads that contributed to driving the run, i.e., at least one of their requests was chosen for triggering.
- Optionally, choose “Group into classes” to group all b-threads of the same class in one column. The sets of requested, waited-for and blocked events shown in each cell are the union of the corresponding sets over all instances.
- Optionally, choose “Group events” to show only one representative event in each cell for the requested/waited-for/blocked events, even if multiple such events exist. Clicking on the button next to the representative name shows the rest of the events.
- Optionally, choose “Static view” in order to get a print-friendly view, without buttons or dynamic content.
- Optionally, choose the syncpoints you want to display: how many syncpoints you want to view per page (or all), and the starting syncpoint number. The first syncpoint shown can be changed later via navigation. Note that the length of the trace that is shown affects the loading time, so it is highly advisable not to display all syncpoints for large traces.
- Press “show” to view the visualization. Note that the loading might take a few minutes.
The TraceVis display
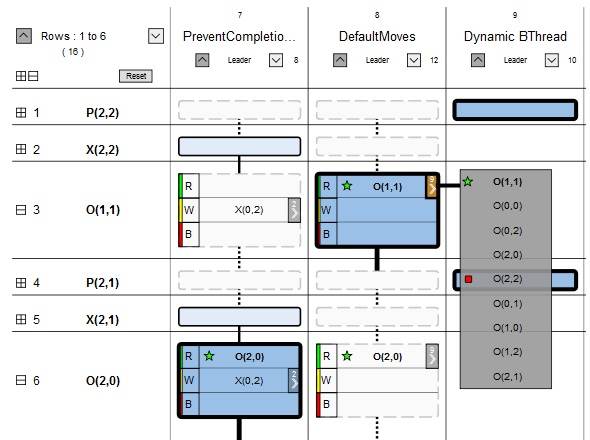
- The following is an example of TraceVis display
- Each row corresponds to a syncpoint. The syncpoint index and triggered event are displayed on the left.
- Each column corresponds to a b-thread, or to a class of b-threads. The b-thread name and type (leader, etc.) are displayed.
- Each cell contains the declarations of the corresponding b-thread at the corresponding syncpoint, after an event is chosen at the syncpoint, before execution is resumed.
- The b-thread's declarations of requested/waited-for/blocked events are shown.
- Instances of the triggered event are emphasized by a green star icon.
- Requested and waited-for events that are blocked are marked by a red square icon.
Cell types display
- The leader cell for the syncpoint , i.e., the one whose request was triggered is emphasized by a dark color and solid bold border.
- An active cell, which also requested and/or waited for the executed event, but didn’t cause it is shown with medium color and solid border.
- ToDo MISSING DESCRIPTION OF ACTIVE FOLLOWER.
- A non-active cell, where the b-thread did not advance, as it neither waited for nor requested is shown with Light color and dashed border)
Collapsing and expanding data
- Each syncpoint can be collapsed, to hide the details. Use the "minus" by the syncpoint name to collapse it. Use the "plus" sign to get the details back.
- Use the plus or minus button in the top-left corner of the visualization to collapse/expand all syncpoints (this may take some time).
- The type of a collapsed cell is indicated by its color and border. Its requested/waited-for/blocked events are not shown.
- When a cell has multiple requested/waited-for/blocked events, and “group events” is chosen, an arrow appears. Click the arrow to show the list of events. The number next to the arrow shows the number of events in the list.
- When the event set is specified by the b-thread by a rule (i.e., all events that with a certain property), the programmed rule itself is not shown. As the set may be very large or even infinite, only the events requested in the present syncpoint that match the rule are shown. The list of event set is shown with a dotted border.
- Use the "Shift" key to scroll down to the next leader cell in any column.
- ToDo: check CYCLE - is it in the whole run or in the screen?
- The index numbers of the displayed syncpoints and their total number of syncpoints appear in the upper-left corner of the window.
- Use the "down" and "up" navigation buttons to display next/previous set of syncpoints.
- Note that displaying a new set of syncpoints may take some loading time.
- Use the navigation buttons next to a b-thread's name to move to the next/previous active cell in the column of this b-thread, that is not in the set of syncpoints currently shown. The index of the syncpoint where this target cell exists appears next to the "down" arrow.
- Use the reset button to return to the main menu.

